When investing, your capital is at risk and you may get back less than invested. Past performance doesn’t guarantee future results.
Price-to-Earnings (P/E) Ratio: Definition, formula, and examples
Every potential investment is characterised by numbers, ranging from the simple to the arcane. Which do you look at first? A company’s price-to-earnings ratio. It tries to tell you how much the stock costs versus how much profit it earns per share.
QUOTE
"People may bet on hourly wiggles of the market, but it's the earnings that waggle the wiggle long term."
Big ideas
- The price-to-earnings ratio is one of the most straightforward metrics of a stock’s attractiveness.
- There are some subtleties to this widely used yardstick you need to be aware of, though.
- In addition, while price to earnings means a great deal, this information shouldn’t be viewed in isolation.
P/E ratio meaning and definition
QUOTE
The price-to-earnings (P/E) ratio is a commonly used financial metric that measures the relationship between a company's stock price and its earnings per share (EPS).
It is used by investors to determine the relative value of a company's shares and to make comparisons among companies.
It is used by investors to determine the relative value of a company's shares and to make comparisons among companies.
What the P/E ratio tells you?
Before we delve into the formal price-to-earnings definition, let’s examine the concept through an analogy. Imagine a bunch of trees for sale at a garden centre; naturally, some are taller than others. The amount of shade each casts largely determines its value, so bigger trees cost more.
That’s not the only factor that defines the worth of a tree, though: those that produce fruit also command a higher price. In fact, if you were planting an orchard, you’d be more interested in how many apples and peaches you could expect each year and less concerned about your trees’ size and growth rate.
In this example, the cost of each tree on the lot is equivalent to a company’s share price, while its fruit yield translates to its net profit. Depending on your gardening and investing goals, a cheap tree that bears loads of fruit – or a company with a low P/E ratio – may well seem like a good bargain.
P/E ratio formula
Though there are no known instances of an ape actually performing a price-to-earnings calculation, it’s well within the capabilities of a reasonably bright chimpanzee. The price-to-earnings ratio formula is simply:
QUOTE
P/E Ratio = Earnings per Share (EPS) / Market Price per Share
Calculation of the P/E ratio and components
Our hypothetical simian mathematician may, however, require a little bit of help researching the numbers it needs to plug into a price-per-earnings calculator. The numerator above the line is easy enough to look up: the stock’s current market value is available from a number of sources.
Choosing the denominator requires a little more thought. One of the considerations is how to treat extraordinary items.
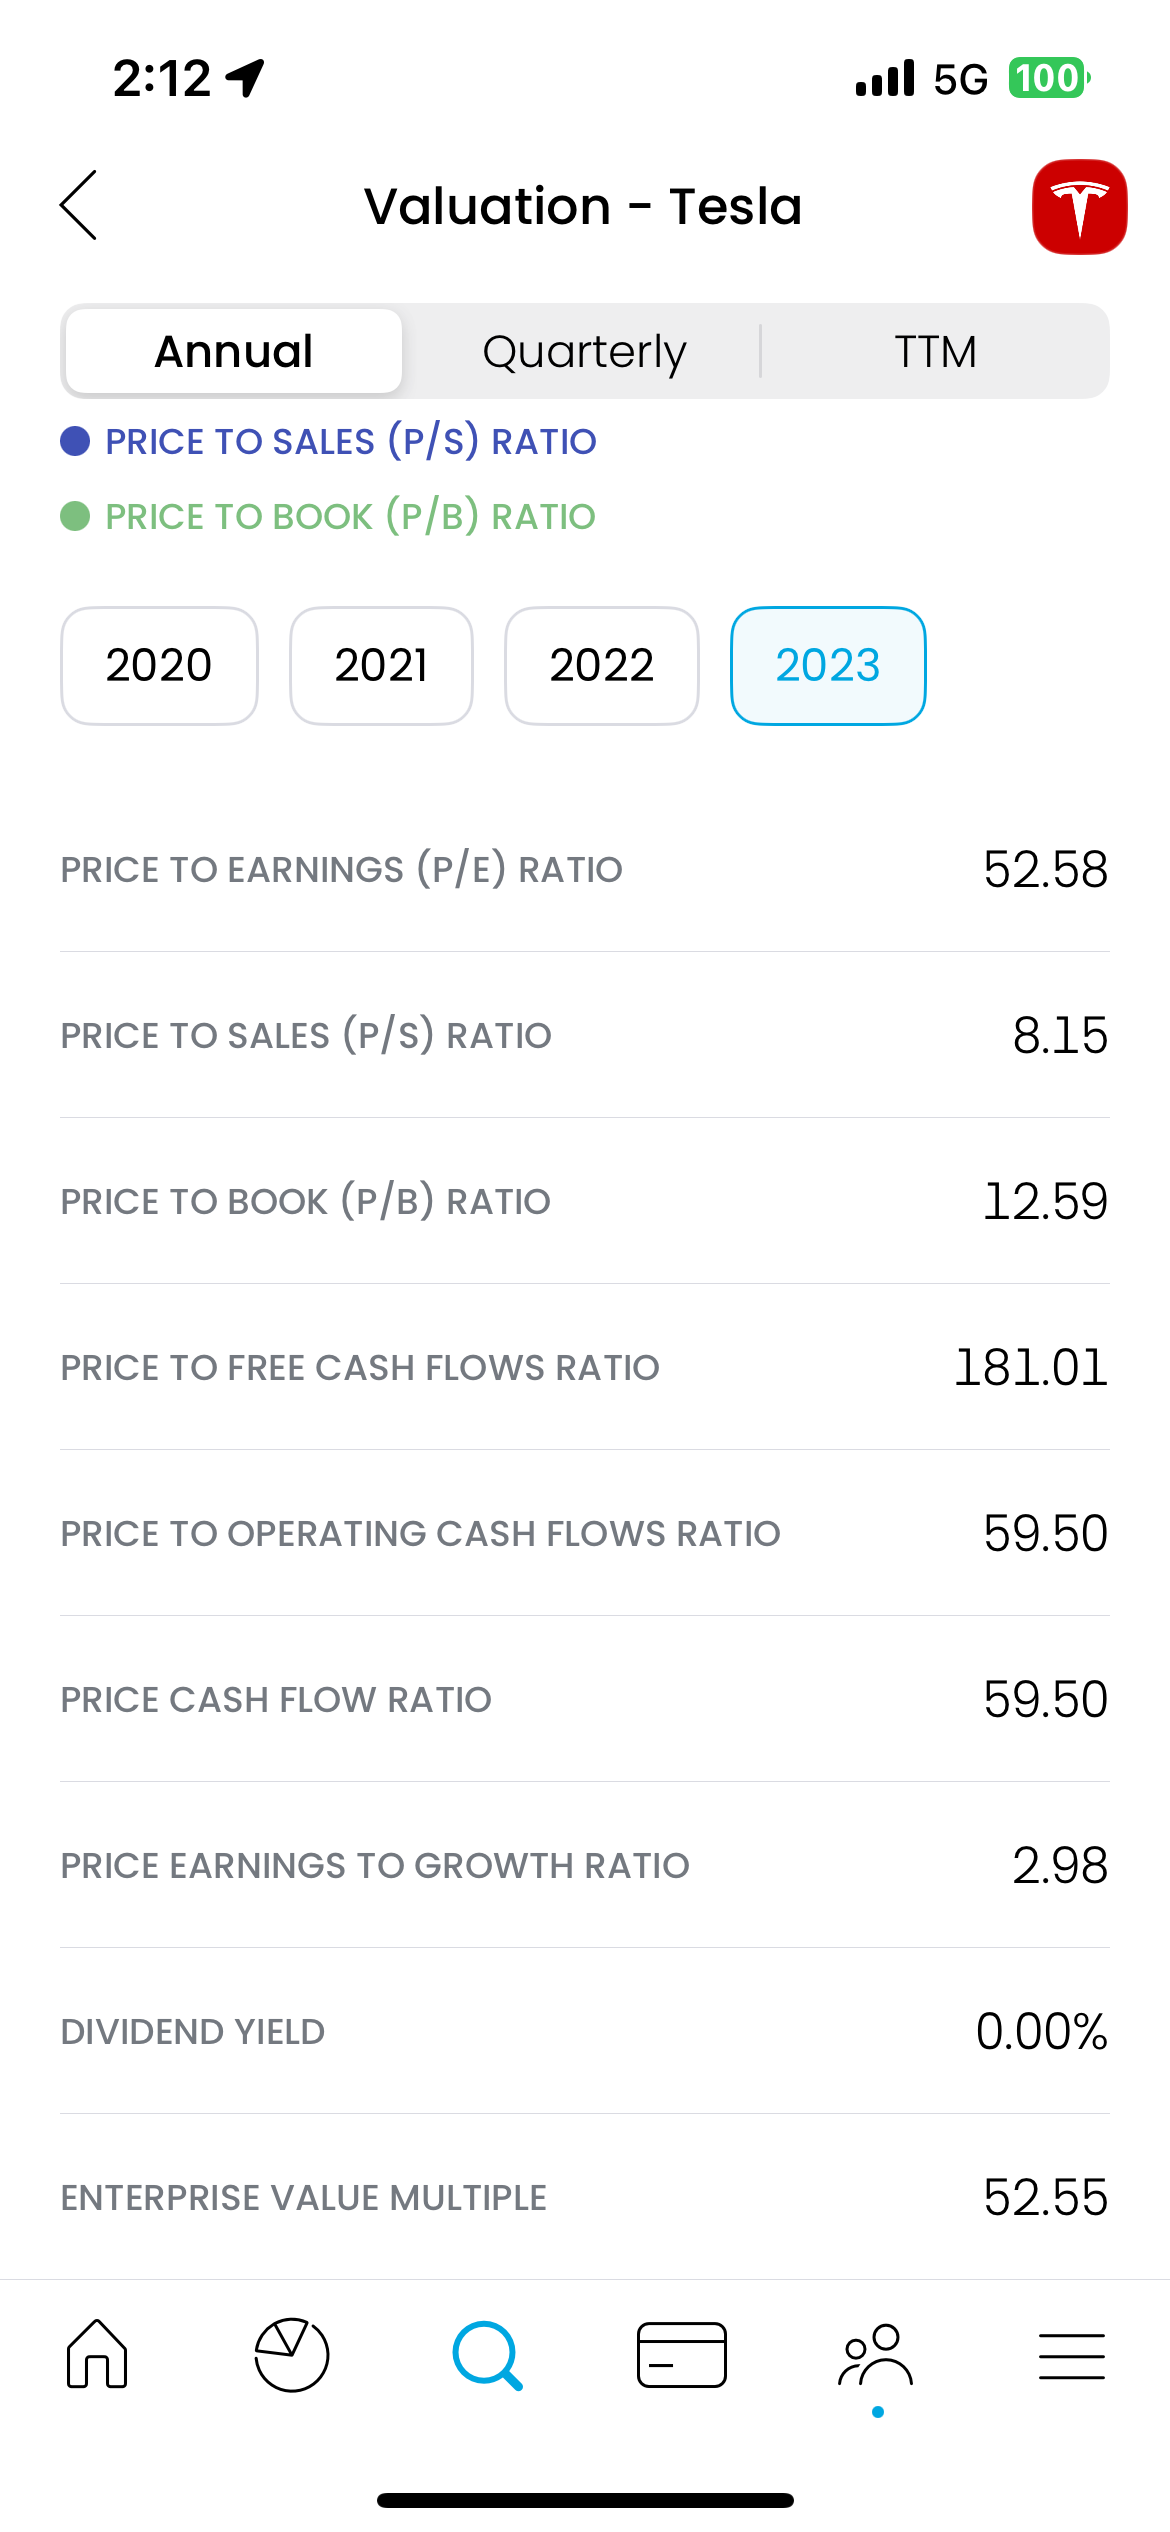
Under ‘All ratios’ and then by scrolling to ‘Valuations’ you can find some different variants on the PE/ formula.
Choosing the denominator requires a little more thought. One of the considerations is how to treat extraordinary items.
Under ‘All ratios’ and then by scrolling to ‘Valuations’ you can find some different variants on the PE/ formula.
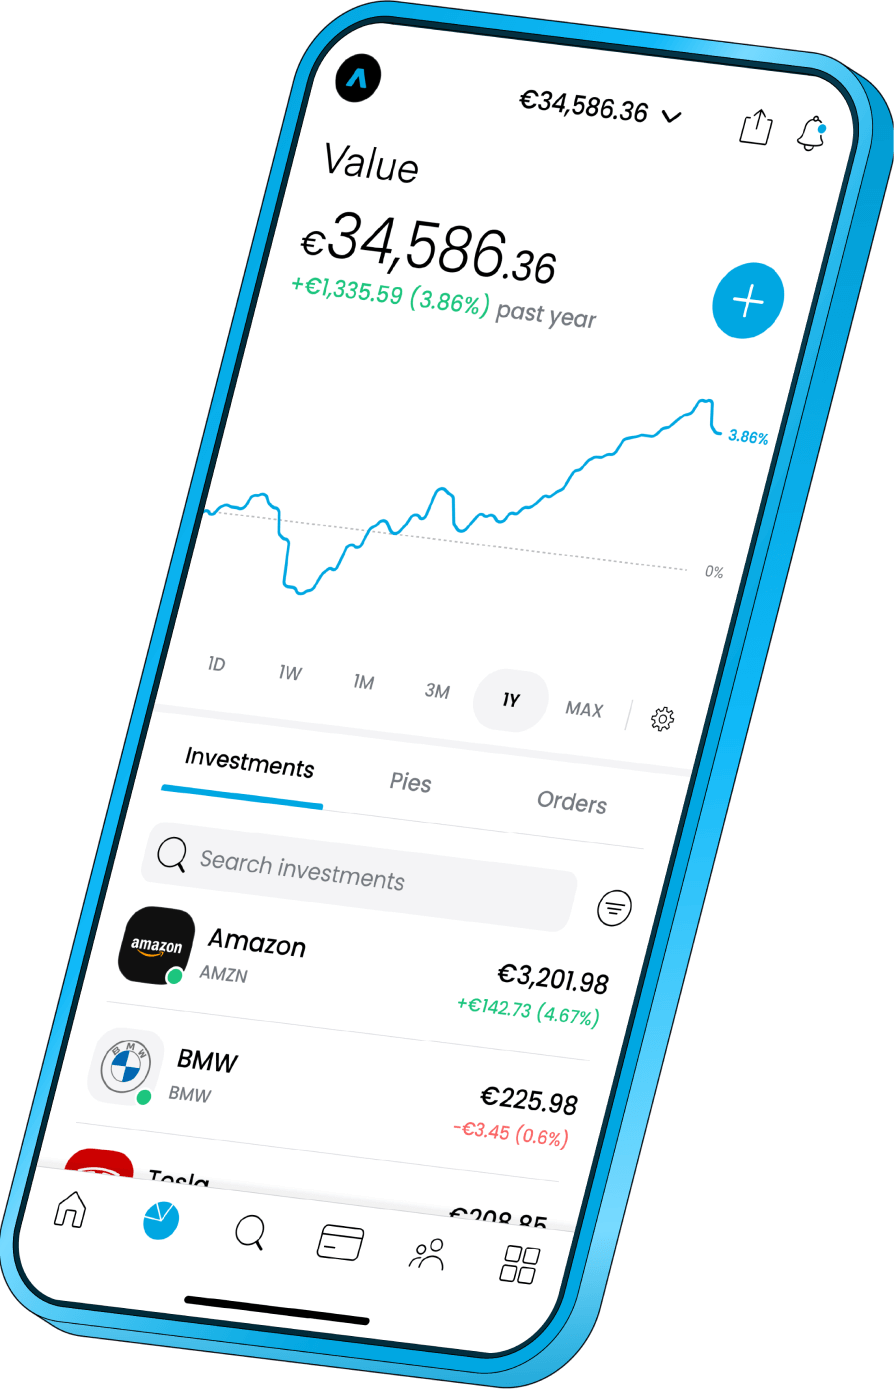
 Source: Trading 212 app
- P/E excluding extraordinary items - LFY: The P/E ratio excluding extraordinary items for the last fiscal year (LFY) is 44.72.
- P/E excluding extraordinary items high - TTM: The highest P/E ratio excluding extraordinary items over the trailing twelve months (TTM) is 1,100.
- P/E excluding extraordinary items low - TTM: The lowest P/E ratio excluding extraordinary items over the trailing twelve months (TTM) is 33.98.
- P/E Basic excluding extraordinary items - TTM: The basic P/E ratio excluding extraordinary items over the trailing twelve months (TTM) is 40.95.
- P/E Normalised - LFY: The normalised P/E ratio for the last fiscal year (LFY) is 40.62.
- P/E including extraordinary items - TTM: The P/E ratio including extraordinary items over the trailing twelve months (TTM) is 44.72.
Note
The P-to-E ratio is undefined for companies that report zero profit. While the price-to-earnings ratio formula does work, mathematically speaking, for small or negative profits, it provides little useful information in these cases and isn’t commonly used.
Example of the P/E ratio
Now that we’ve more or less seen price-to-earnings explained, let’s see how this ratio works in practice.
At the time of writing, Tesla (TLSA) shares are trading at $171.43 while its earnings per share over the past twelve months amount to $4.30. The Trading 212 app then easily shows you the end result, that the price-to-earnings ratio of Tesla is therefore 40.62.
At the time of writing, Tesla (TLSA) shares are trading at $171.43 while its earnings per share over the past twelve months amount to $4.30. The Trading 212 app then easily shows you the end result, that the price-to-earnings ratio of Tesla is therefore 40.62.
 Source: Trading 212 app. Capital at Risk. Past performance is no guarantee of future results.
A perhaps more representative example is the price-to-earnings ratio of the FTSE 100 is only 14.94. This lower number reflects the fact that almost half of that index’s value consists of companies in more traditional sectors: petroleum, mining and metals, financial services, and pharmaceuticals. Tech stocks tend to enjoy higher P-to-E figures; the NASDAQ 100’s price-to-earnings ratio is currently 21.81.
Importance of the P/E ratio in stock valuation
Price-to-earnings ratios are a good headline indication of a stock being under- or overvalued. A huge, expensive tree that hasn’t produced a good harvest in years (low P/E) could be past its prime, though paying a premium for a sapling covered in blossoms (high P/E) may also not be wise.
Most investors consider this number nearly as important as a company’s dividend record and recent share price growth.
Most investors consider this number nearly as important as a company’s dividend record and recent share price growth.
Note
As useful as it is, a single metric can hardly tell the whole story. When making investment decisions, P/E ratios are generally studied alongside other criteria, like each company’s level of debt relative to its equity, its profitability, short-term liquidity, and general market outlook.
Types of P/E ratios
The need to take the latter into account means there are two basic ways of determining a price-to-earnings ratio:
1. Trailing P/E ratio: Analysing historical earnings
Considering that the price-to-earnings ratio formula only contains two variables, any error in either is likely to throw off your calculations considerably. Given the potential consequences of using bad data, there’s definitely something to be said for using firm, audited figures for earnings.
For this reason, the most common method for determining price to earnings, TTM or Trailing Twelve Months, is based on a company’s net profit over the preceding year. For long-term investing, P/E ratios are often calculated based on earnings for the past ten or even thirty years.
For this reason, the most common method for determining price to earnings, TTM or Trailing Twelve Months, is based on a company’s net profit over the preceding year. For long-term investing, P/E ratios are often calculated based on earnings for the past ten or even thirty years.
2. Forward P/E ratio: Looking at future earnings
Some fruit trees take a long time to mature, yielding nothing for years and only then becoming productive. Others’ fertility fluctuates along with the weather. In these cases, as well as their corporate equivalents, tracking historical data is of limited use, if not actively misleading, when estimating the future potential of an investment.
Forward price-to-earnings figures, meaning those based on anticipated profits, can paint a more illuminating picture of companies in less stable industries. Fortunately, the guidance on future earnings per share released by all listed companies is based on accounting guidelines established by the U.S. Securities and Exchange Commission or the U.K. Financial Conduct Authority. There is still some guesswork involved, though, and external analysts’ projections are often at odds with company estimates.
Forward price-to-earnings figures, meaning those based on anticipated profits, can paint a more illuminating picture of companies in less stable industries. Fortunately, the guidance on future earnings per share released by all listed companies is based on accounting guidelines established by the U.S. Securities and Exchange Commission or the U.K. Financial Conduct Authority. There is still some guesswork involved, though, and external analysts’ projections are often at odds with company estimates.
Comparative P/E ratio: Benchmarking peers
Again, companies that operate in markets with relatively stable prices and volumes – like steel, electricity, or transportation – tend to have fairly low price-to-earnings figures. Barring some unforeseen shake-up in those markets, like the invention of cold fusion, their profits are likely to remain stable.
On the other hand, businesses dealing in commodities with growing or unstable demand – semiconductors or luxury goods, for instance – tend to trade at higher P/E ratios. You could say that investors are willing to pay a premium for the greater upside, even once they’ve factored in the attendant risks. (Bear in mind that we are talking about established companies here, not wet-behind-the-ears startups.) A perfectly respectable price-to-earnings number in one line of business may be highly worrying in another industry.
It therefore only makes sense to compare P/E ratios between companies in the same sector or – better yet – with competitors that share similar business cycles, markets, and business models. To stick with the fruit tree analogy, if you want to evaluate the profitability of an orange grove, you need to compare it with other members of the citrus family, not apples.
For example, the Vodafone Group (VOD), BT (BT.A), and Spirent Communications (SPT) are all technology companies with a broadly similar focus, yet their P-to-E ratios are 15.73, 7.29, and 35.01 respectively. These discrepancies will encourage the savvy investor to dig deeper and discover the differences between their operations and outlook.
The following table lists the average price-to-earnings ratio by industry in the United States.
Industry | P/E ratio |
Aerospace/Defense | 36.96 |
Broadcasting | 13.11 |
Coal & Related Energy | 9.07 |
Electronics (Consumer & Office) | 106.94 |
Farming/Agriculture | 28.17 |
Hotel/Gaming | 19.15 |
Oil/Gas (Production and Exploration) | 10.81 |
Precious Metals | 13.09 |
Real Estate (General/Diversified) | 19.43 |
Semiconductor | 50.38 |
Steel | 13.57 |
Transportation | 13.22 |
Source: Aswath Damodaran
Interpreting the P/E ratio
Price-to-earnings ratios are also sometimes called “price multiples”. The reasoning behind this is simple: if an investment of some kind costs £100 and makes £10 of profit each year, its P/E or price multiple is equal to ten. For every ten pounds you invest, you can expect to get one pound back every year, perhaps in the form of dividend payouts or growth in share price due to earnings being reinvested by the company’s management.
Of course, this is a somewhat simplified way of looking at things. Price-to-earnings ratios offer a quick, shorthand way of describing a stock, particularly when talking about whether it seems to be trading at a discount given the amount of money its normal business activities bring in. It’s especially helpful when seen in the context of past P/E numbers for the same company or used as a basis for comparison with a market index or industry benchmark.
Of course, this is a somewhat simplified way of looking at things. Price-to-earnings ratios offer a quick, shorthand way of describing a stock, particularly when talking about whether it seems to be trading at a discount given the amount of money its normal business activities bring in. It’s especially helpful when seen in the context of past P/E numbers for the same company or used as a basis for comparison with a market index or industry benchmark.
Interpreting the P/E ratio: Key insights
- If a company’s forward P/E is higher than its trailing P/E, analysts believe its fortunes are likely to improve.
- An industry or stock with a low price-to-earnings ratio can be considered mature, stagnant, or even declining.
- An industry or stock with a high P/E may be poised for significant growth. Alternatively, it could simply be overvalued and due for a downward price correction.
- At the end of the day, a price-to-equity ratio is just a single number. It may draw your attention to a promising stock or warn that another costs too much, but it isn’t by itself a good reason to invest or divest.
Assessing the earnings potential of a company
It’s worth remembering that no stock would ever achieve a high price-to-earnings ratio if investors weren’t willing to buy shares at that level. In this sense, a high P/E represents a collective vote of confidence: it is a sign that informed parties believe that a company’s profits or value can be expected to rise.
Unfortunately, the market does sometimes turn out to be wrong, perhaps due to information being misinterpreted or a simple bandwagon effect. There is also a time lag between new data being reported and a share’s price (and, hence, its P/E) adjusting to a new level. For instance, a company that’s just announced having had an unexpectedly good quarter may well show a modest price-to-earnings figure, simply because profits have boomed and the share price still has to catch up.
Unfortunately, the market does sometimes turn out to be wrong, perhaps due to information being misinterpreted or a simple bandwagon effect. There is also a time lag between new data being reported and a share’s price (and, hence, its P/E) adjusting to a new level. For instance, a company that’s just announced having had an unexpectedly good quarter may well show a modest price-to-earnings figure, simply because profits have boomed and the share price still has to catch up.
Value investing and low P/E stocks: Identifying overvalued and undervalued stocks
Such a situation would clearly describe an undervalued stock. Value investors – those who follow a strategy of buying into companies whose fundamental business value is higher than their market capitalisation – often use price-to-earnings ratios as a quick way to scout for bargains. In theory, any stock with a low P/E (or, more precisely, one that’s below the average for its industry) may possess unrecognised potential.
Of course, things are rarely that simple, so this isn’t a hard-and-fast rule. In fact, dedicated value investors may well prefer other metrics, like a company’s book-to-market ratio, as indications of its underlying value.
Of course, things are rarely that simple, so this isn’t a hard-and-fast rule. In fact, dedicated value investors may well prefer other metrics, like a company’s book-to-market ratio, as indications of its underlying value.
QUOTE
"It's far better to buy a wonderful company at a fair price than a fair company at a wonderful price."
Growth Investing and high P/E Stocks: Picking future high performers
Growth investing strategies are often contrasted with value-based approaches, though the two are hardly incompatible. With growth investing, however, the emphasis is on growing your invested capital. This usually implies more frequent trades and more investments in young, fast-growing companies.
On the surface, a stock with a high price-to-earnings ratio should be like catnip to a growth investor. Simply put, its earnings (and hence its share price) are expected to grow at a rate exceeding the market or sector average. Again, though, a single number like P/E doesn’t tell the whole story. Forward ratios, in particular, should be taken with a grain of salt and substantiated by careful analysis of a company’s fundamentals and prospects.
On the surface, a stock with a high price-to-earnings ratio should be like catnip to a growth investor. Simply put, its earnings (and hence its share price) are expected to grow at a rate exceeding the market or sector average. Again, though, a single number like P/E doesn’t tell the whole story. Forward ratios, in particular, should be taken with a grain of salt and substantiated by careful analysis of a company’s fundamentals and prospects.
Limitations of the P/E ratio
The first drawback of the price-to-earnings ratio is that, unlike many other financial metrics, it only allows sensible comparisons between similar stocks or the same stock at different times. Intuitively, you would expect a cellular network operator and a company specialising in internet telephony to be much alike, yet their respective P/Es may reflect a different reality.
P/E ratios also don’t yield substantive information about the value of a company that may have significant assets, including intellectual property, and considerable future earning potential.
In the 1980s, for example, P/E was regarded as a kind of holy grail when it came to assessing the value of companies. Large, cash-rich companies were falling over themselves to buy out smaller, more profitable concerns with low price-to-earnings ratios.
As often happens when a herd mentality develops, the game was truly up once reality reasserted itself. Though it certainly wasn't the sole cause of the 1987 market crash, the M&A craze and an overreliance on P/E as a primary financial indicator certainly didn't help.
P/E isn't everything, but it also can't be ignored. During the dot-com bubble of the late 90s, people were told that the internet would deal a body blow to long-standing accounting conventions if not the laws of physics itself. Numerous companies with online business models achieved IPO status and saw massive growth in share prices without ever having made a cent in profit.
The P-to-E ratios of these stocks were, of course, negative and, therefore, essentially meaningless. The price to earnings of the S&P 500, however, reached a peak of no less than 47, compared to its historic average of about 25. There was simply too much money in the stock market invested in companies that made too little profit. In hindsight, this situation was obviously unsustainable, though this certainly wasn’t clear at the time. Disregarding the market’s P/E cost many investors their shirts.
Recap
Anyone can calculate or look up the current price-to-earnings ratio for a stock, a market index, or even an entire country. At times, this may seem like all that’s needed to identify an undervalued investment or one that’s at risk of a dramatic fall in value.
Realistically, though, no single financial ratio is a substitute for detailed analysis. P/E figures are easy to misinterpret when viewed in isolation. The price-to-earnings ratio formula is only one of the tools at your disposal; good at its job but not applicable to every task.
Realistically, though, no single financial ratio is a substitute for detailed analysis. P/E figures are easy to misinterpret when viewed in isolation. The price-to-earnings ratio formula is only one of the tools at your disposal; good at its job but not applicable to every task.